


Another data dump

I wish I had something more interesting to talk about, but sadly I’ve been spending my winter evenings on my laptop with my cat doing data analysis (as a nice change from my day job which entails sitting with my cat doing data analysis).
You may remember I downloaded and compiled all of Liverpool City Council’s invoices over £500 into an interactive dashboard. Well that runs on PowerBI, which I only have a free demo version of, and Microsoft have been RINGING MY ACTUAL PHONE trying to sell me a licence and I hate Microsoft and its shitty, unreliable, time consuming products so much I don’t trust myself to answer in a sweet and cheerful manner.
So I decided to take a look at some software called Tableau, which is delightful, user friendly and most importantly, free. It was such a dream to use I grabbed as much data as I could find and stuck it all into one place. And so voilà… at least five years’ worth of invoices for Liverpool City Region and Greater Manchester Combined Authorities and Liverpool, Wirral, Sefton and Knowsley Councils. If there are any other public bodies you’re itching to look at the payments for, let me know, and if I can be arsed, I’ll add them. While the local authorities, in line with the 2015 Local Government Transparency Code, publish all this on their websites, they do so in separate monthly or quarterly spreadsheets each containing several thousand rows of data. This means that even if you knew what you were looking for, you’d need to have a good idea of the exact month the supplier was paid. These dashboards make it easy to search for a particular payment or browse by supplier, category and/or time period.
Hopefully they should be quite intuitive to use. The tables are sorted in order of total spend (highest value at the top, most recent year to the left). There’s search boxes at the top but you can also click on a supplier in the top box and see a breakdown of the categories in the bottom box, and vice versa. So for example, if you want to know why Liverpool City Council has paid the Duchy of Lancaster £93,126.21, just click and you’ll see it’s gone on rent.

Or if you’re wondering who the LCRCA spent £15m on hydrogen powered buses with, just select that category…

A few tips and disclaimers: these are uploaded by each individual authority monthly, and some (Wirral) go right back to 2013. Because computers have mere humans operating them, there are understandable errors and ambiguities. For instance, there may be multiple spellings of supplier names, categories and descriptions, but this can be overcome by using the search box, typing a few letters and then selecting all the different variations (don’t forget to deselect ‘All’ first). Example:
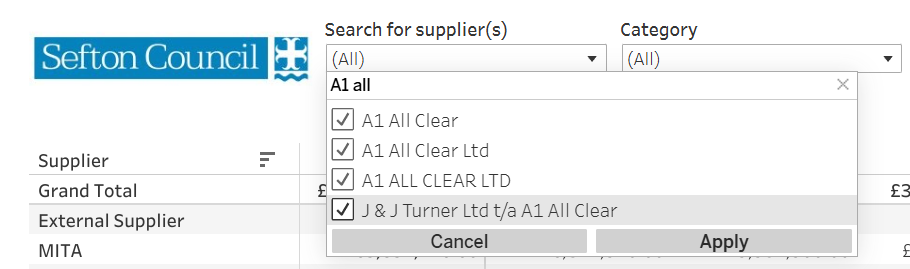
There are some months missing because they were uploaded incorrectly or corrupted (LCR July 2021, Sefton July & August 2023, Knowsley October 2023) and I’ve emailed asking for replacements. You can find the original webpage by clicking on the relevant logo. I do not take any responsibility for any errors made in processing or interpreting this data and please do not come round and put my windows in.
If you have any feedback, or if you find anything juicy, please get in touch.
This is fabulous Helen
Thank you so much for all the hard work! I'm sure something invaluable will be dug up from all this data. ✌️❤️✊️