

Everything Everywhere All in One Spreadsheet
Everything Everywhere All in One Spreadsheet
See what I did there

Me again. I bet you’re getting sick of me. This probably won’t be the last post this week either, seeing as Liverpool City Council must respond to the Freedom of Information request I send back in October by Wednesday or potentially be taken to the High Court, so I’m sure I’ll write an update about that.
Since I got hold of the 49 spreadsheets detailing nearly £2.2bn worth of spend by Liverpool City Council over four years, it’s awoken the latent data analyst in me. I wanted to present the data in a way that was transparent and comprehensive, so I wrangled with Microsoft’s Kafkaesque requirements for free trials in Excel and PowerBI and did my best to lay it out in a way that I hope is accessible to normal people who don’t speak in DAX formulas and pivot tables.
I’ve made a dashboard so the data can be sliced and digested in two ways - firstly by supplier, so you can see how much each individual company or organisation has been paid, and what for, and secondly by service area, so you can see how the overall budget is broken down by departments, purpose and then supplier. I hope this makes sense, and welcome any feedback - but be quick, my free PowerBI trial runs out in 58 days and I have no idea what will happen to it then.
Click to view the dashboard
Instructions
Firstly, this is best viewed on a laptop or PC screen. I’m sorry it’s not the most accessible and some of the fonts are tiny, but you should find if you hover your cursor over any value there’ll be a pop-up that is easier to read.
There are two pages to the dashboard - at the bottom centre of the screen there’s arrows with ‘1 of 2’ or ‘2 of 2’ to swap between them.
The first page lets you select a supplier from the grey box on the left - if you want to select multiple suppliers then hold the Ctrl key while clicking. You can also search for a supplier by typing in the box. To reset it, there’s a little icon in the top left corner that says ‘clear selections’. Once you’ve selected your supplier(s) you can further split the payments up by financial year by clicking on the boxes in the top right. The overall total spend is in bold, in the bottom right corner.

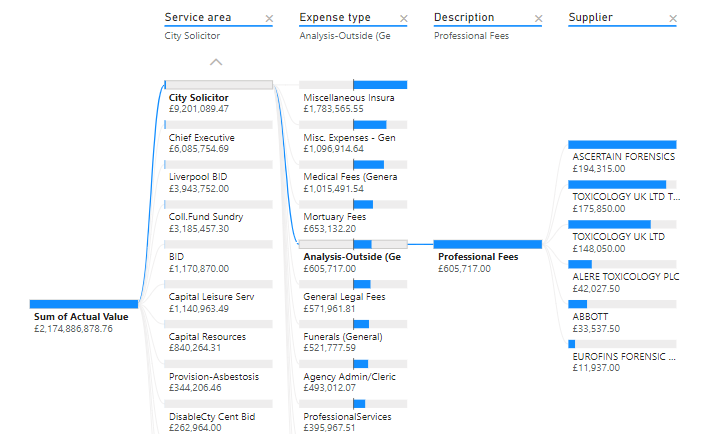
The second page is probably a little less intuitive, and at times you might be faced with a blank screen, but once you get the hang of it, it’s quite interesting to play around with. Clicking on the blue bar with “Sum of Actual Value” on it opens up a number of service areas to the right, so you can see how that £2.174bn is divided up. Then you can pick a Service area, click on it and see what the money was used for. Lastly, you can see who the money was spent with. There are 23 service areas, so you might need to use the arrows at the top and bottom of each column to scroll. Again, you can select to filter the expenditure from individual or multiple financial years.
In the course of putting this dashboard together, I was really only trying to get the data collated and displayed correctly in the interests of transparency and accountability - I’ve not really been scrutinising the data to look for anything interesting or potentially scandalous. At one point, I did think I had a scoop when it looked like 80% of the payments hadn’t been assigned a Service Area or Expense Type, but it turned out my computer had decided to, excuse the technical jargon, ‘shit the bed’. So a fair amount of my time was spent trying to fix that (though I want to say I have still managed to have something of a social life this weekend).
A couple of things did jump out at me, of course, but I’ve not had time to look into them (nor is it my job to, I’m still on the dole!). Seeing as it was only announced last month that the ACC Liverpool Group (M&S Arena/Echo Arena/Kidderdome to you and me) owed the council £7.1m and the council had set aside £2.5m to cover a default, it was strange to see that despite there being 2 months of the financial year left, the council were already making the highest payments to ACCL in three years:

Even weirder, is that this financial year alone, the council paid £179,819 for ‘Electricity/Energy costs’. And in financial years 2019/20 and 2020/21 alone, they paid £1.9 million to the ACCL for ‘Car Parking Charges’ under the ‘Corporate Management’ service area. In November 2018, the Arena’s burnt out car park was demolished (11 months after the fire) and the new multi-storey, which is council owned, opened some time in 2020. Has there ever been a more generous council than Liverpool when it comes to paying for parking?
Anyway, there could be a totally innocent explanation for all this, and maybe it’s all a good use of taxpayers money, but as many people seem keen to ensure, it’s not my job to find that out. But if the people at the council who must read this newsletter want to give their side of the story, get in touch and I’d be happy to put the record straight. Anyone else is also free to email me at that same link with offers of paid employment.
Thanks Helen much appreciated the excellent work you are doing 🙏🙏